Dynatrace Observability on Linode
Not available OOTB, here is how you set it up
Background
If you have read some of my previous blogs, you would know I use Linode (Akamai Compute) to host my website and a few other apps. Now, Linode is great but lacks OOTB support for some of the market-leading observability platforms. I, for one, decided to look at Dynatrace and plan to document the instructions on how to set it up in this blog. Now, there are other great tools out there like Datadog, New Relic, etc., but I wanted to begin with Dynatrace. You could apply similar installation logic to any other tool as well to instrument data to these platforms for full-stack observability panels and dashboards.
Right, let’s get started then.
After deploying my SSG blog on an Ubuntu VM via Linode/Akamai, I registered for a Dynatrace account. I am currently using their 15-day free trial to familiarize myself with the tool and see how it can benefit my setup.

With our Dynatrace account ready, let’s walk through the steps to configure full-stack observability on our Linode Linux VM.
- Log into dynatrace.com
- Select OneAgent under getting started
- Follow the below instructions to complete agent installation
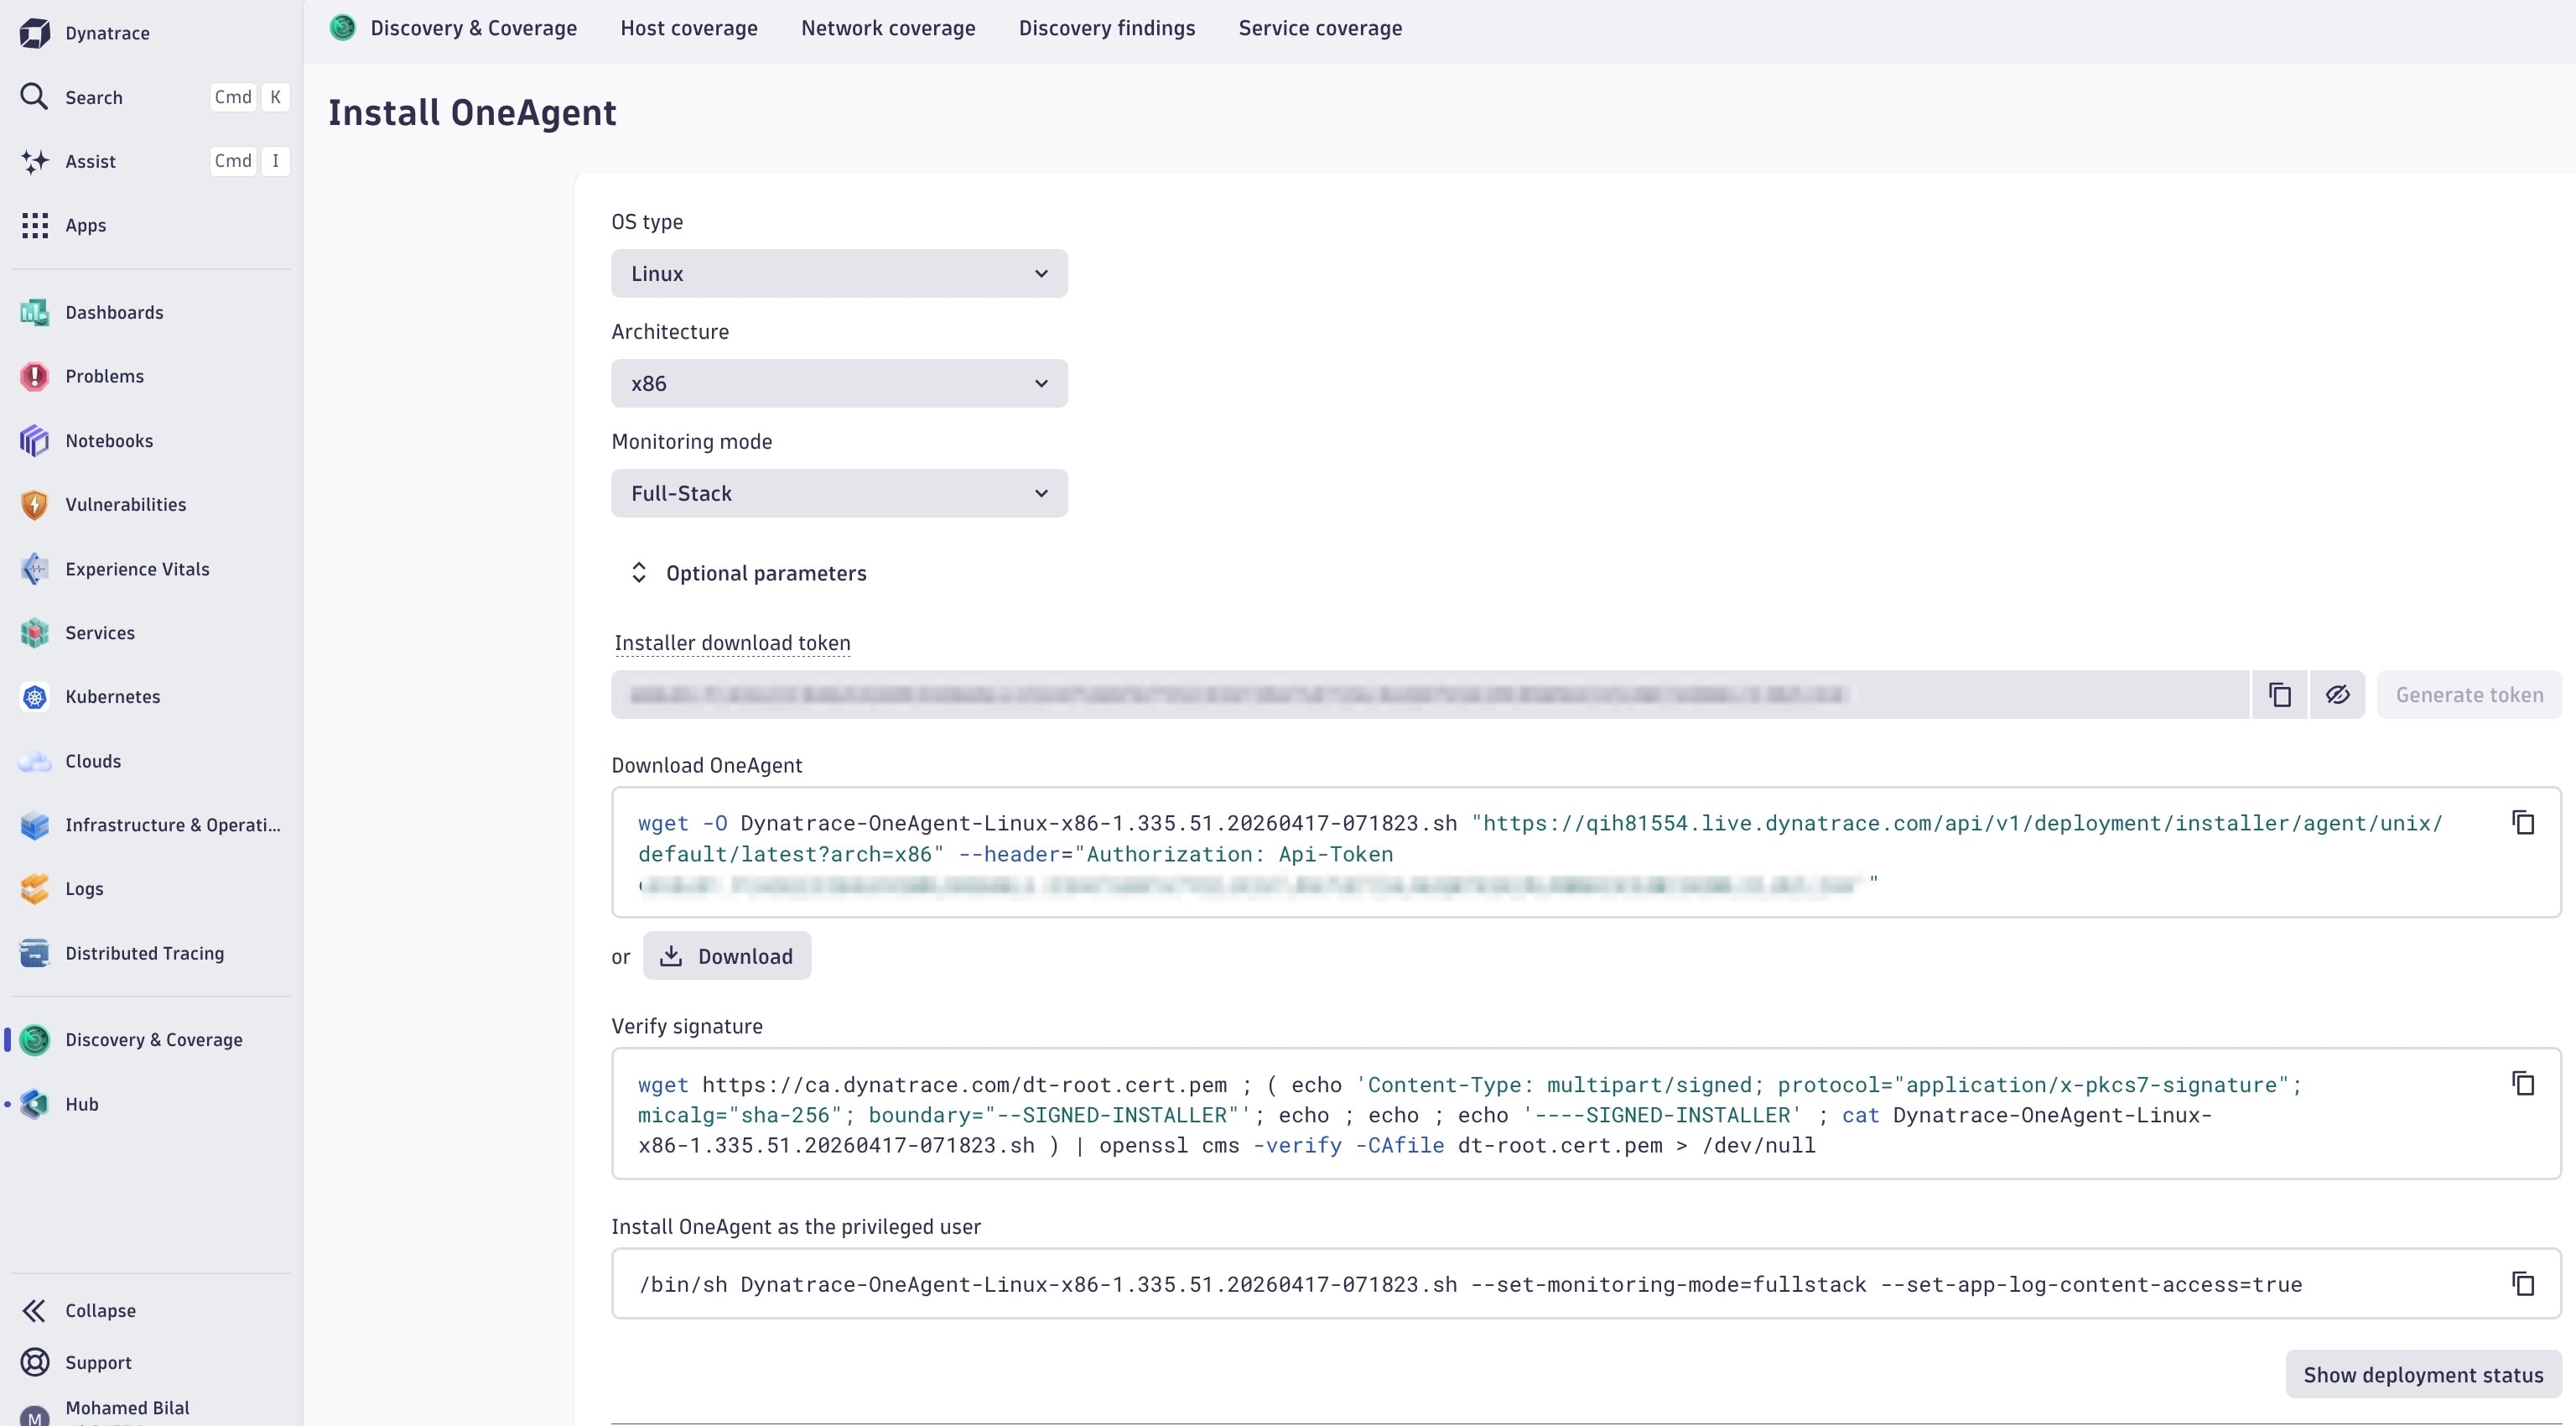
A successful installation would look like this on the terminal -
/bin/sh Dynatrace-OneAgent-Linux-x86-1.335.51.20260417-071823.sh --set-monitoring-mode=fullstack --set-app-log-content-access=true
17:09:39 Checking root privileges...
17:09:39 Process real user: root, real ID: 0
17:09:39 Process effective user: root, effective ID: 0
17:09:39 Process root access: true
17:09:39 Logging to /var/log/dynatrace/oneagent/installer/installation_19906.log
17:09:39 Installation started, version 1.335.51.20260417-071823, build date: 17.04.2026, PID 19906.
17:09:39 Detected platform: LINUX arch: X86_64
17:09:39 Checking /opt/dynatrace/oneagent for prohibited mount flags
17:09:39 Checking free space in /opt/dynatrace/oneagent
17:09:39 Extracting...
17:09:40 Unpacking. This may take a while...
17:09:59 Unpacking complete.
17:09:59 Checking if an operating system is supported...
17:10:00 The operating system is supported, continuing installation.
17:10:00 Moving new binaries into lib folders...
17:10:00 User 'dtuser' added successfully.
17:10:00 Non-privileged mode is enabled.
17:10:01 Checking free space in /lib/x86_64-linux-gnu
17:10:01 Verifying auto-injection compatibility...
17:10:01 Auto-injection compatibility check result: OK
17:10:01 Refreshing dynamic linker runtime bindings using ldconfig
17:10:01 Disabling Apport service
17:10:01 Updating /proc/sys/kernel/core_pattern with oneagentdumpproc
17:10:08 Starting agents...
17:10:08 oneagent service started
17:10:08 Checking if agent is connected to the server...
17:10:14 Dynatrace OneAgent has successfully connected to Dynatrace Cluster Node. You are all set. The Dynatrace OneAgent is fully operational.
Click “Show Deployment Status” to confirm it’s successfully setup
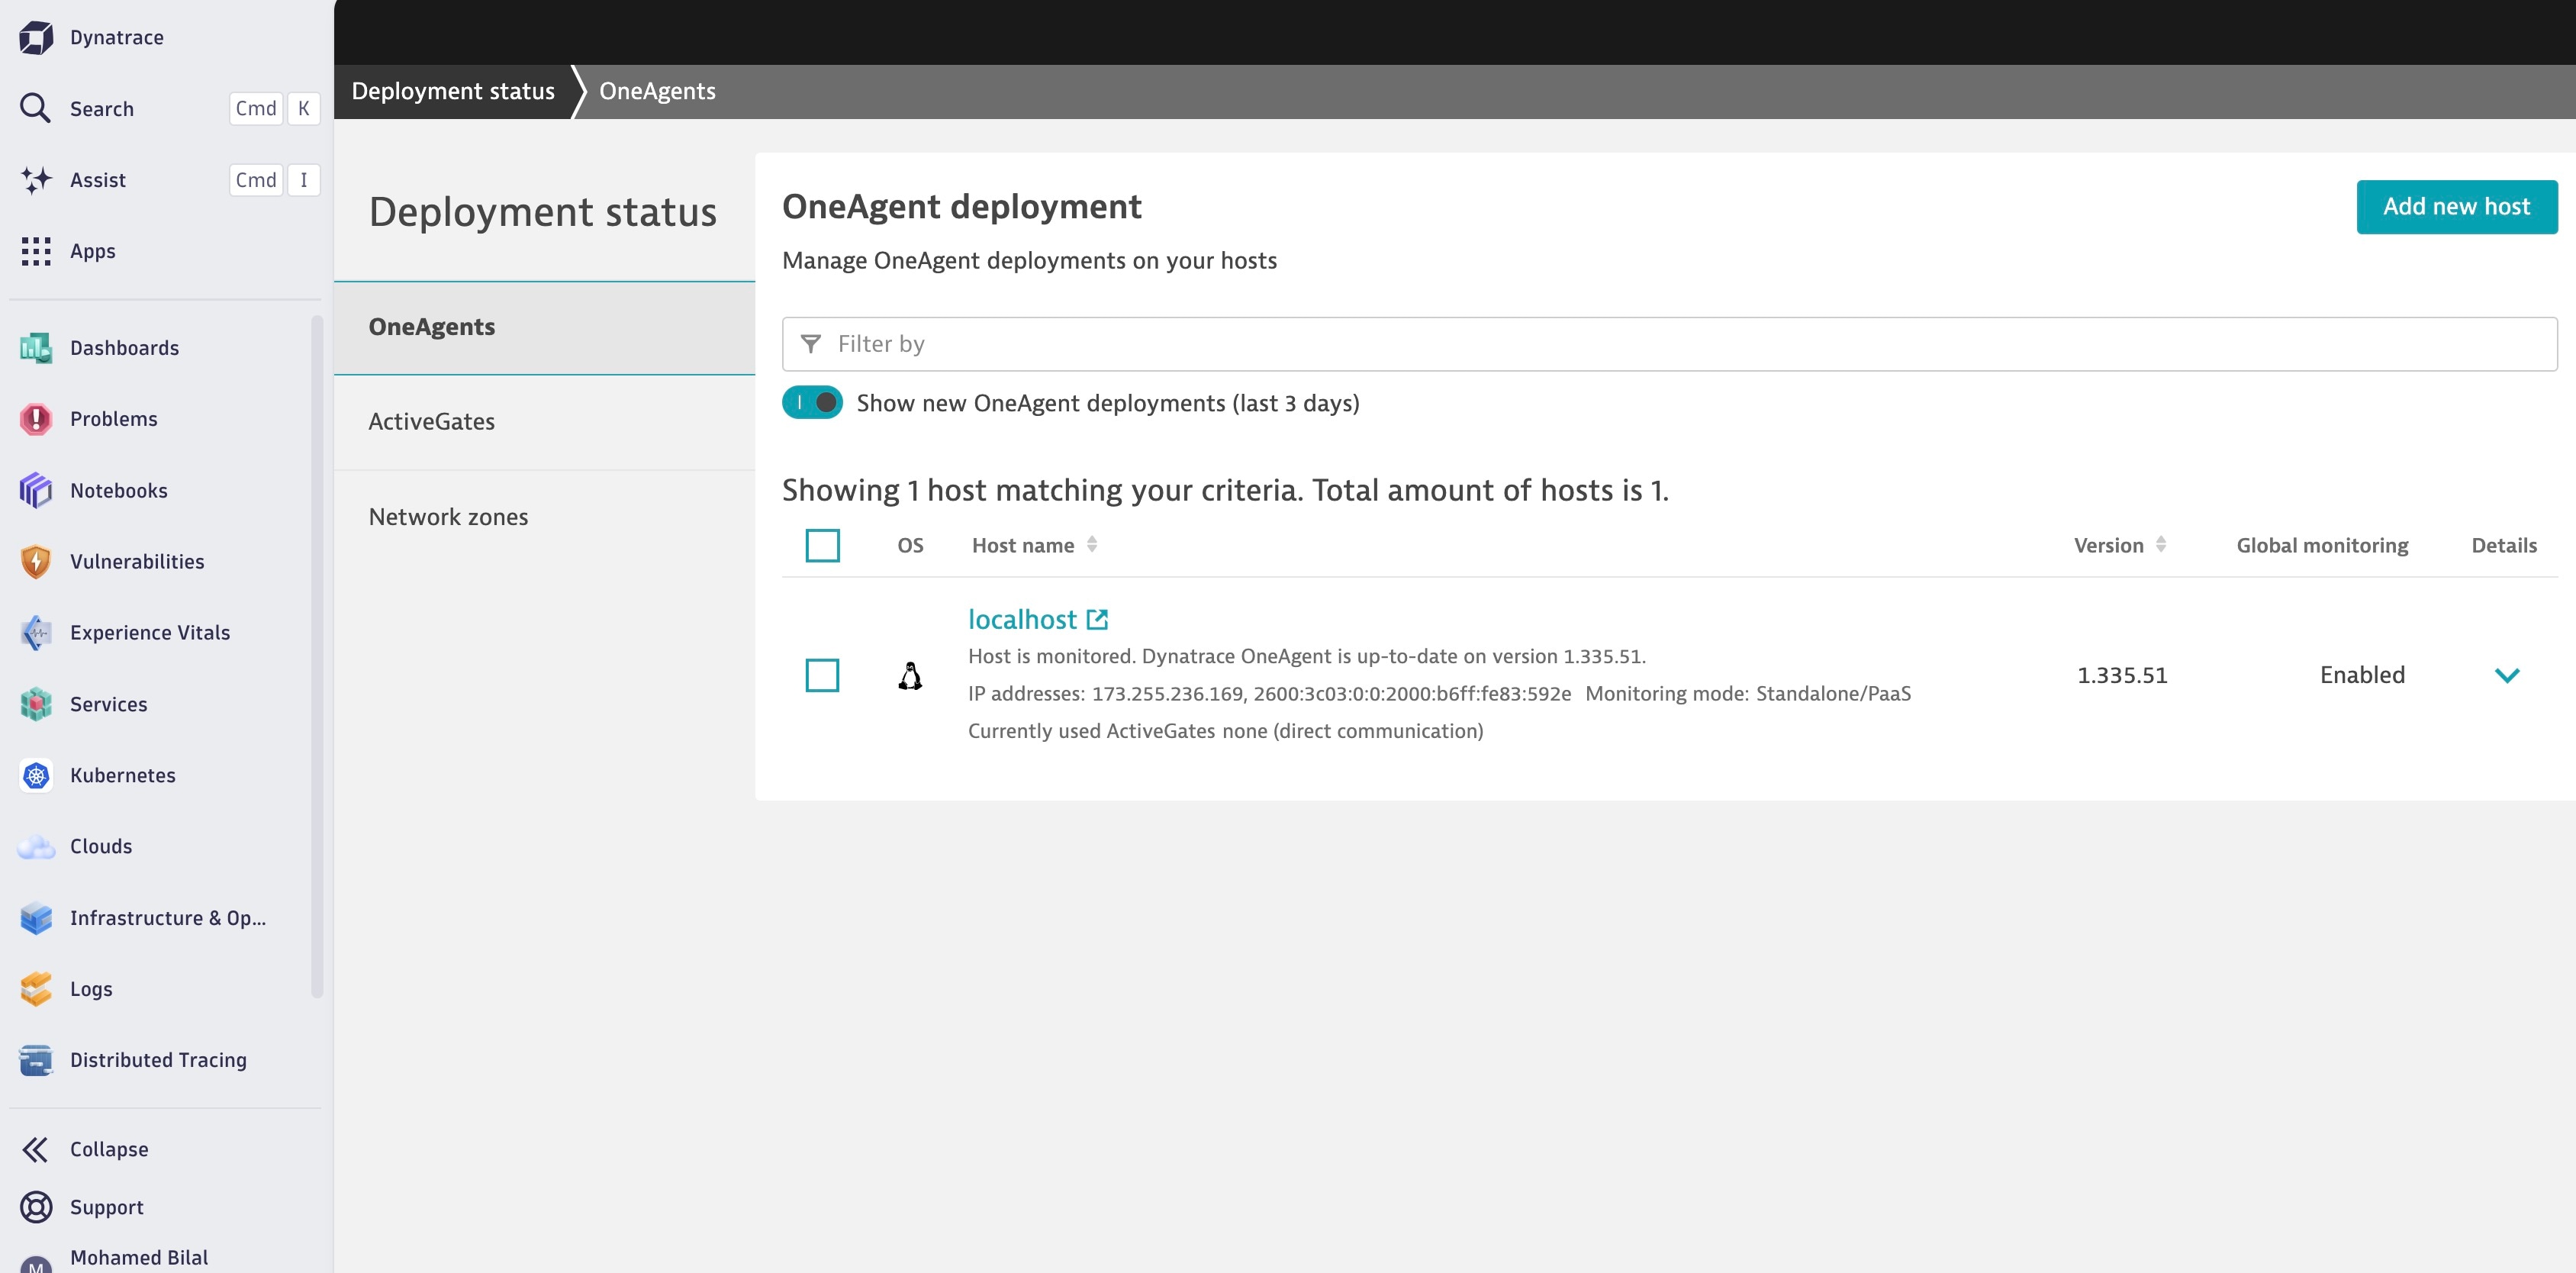
Next, let’s navigate to the specific host to verify that our APM instrumentation was successful. See the snapshots below for reference.
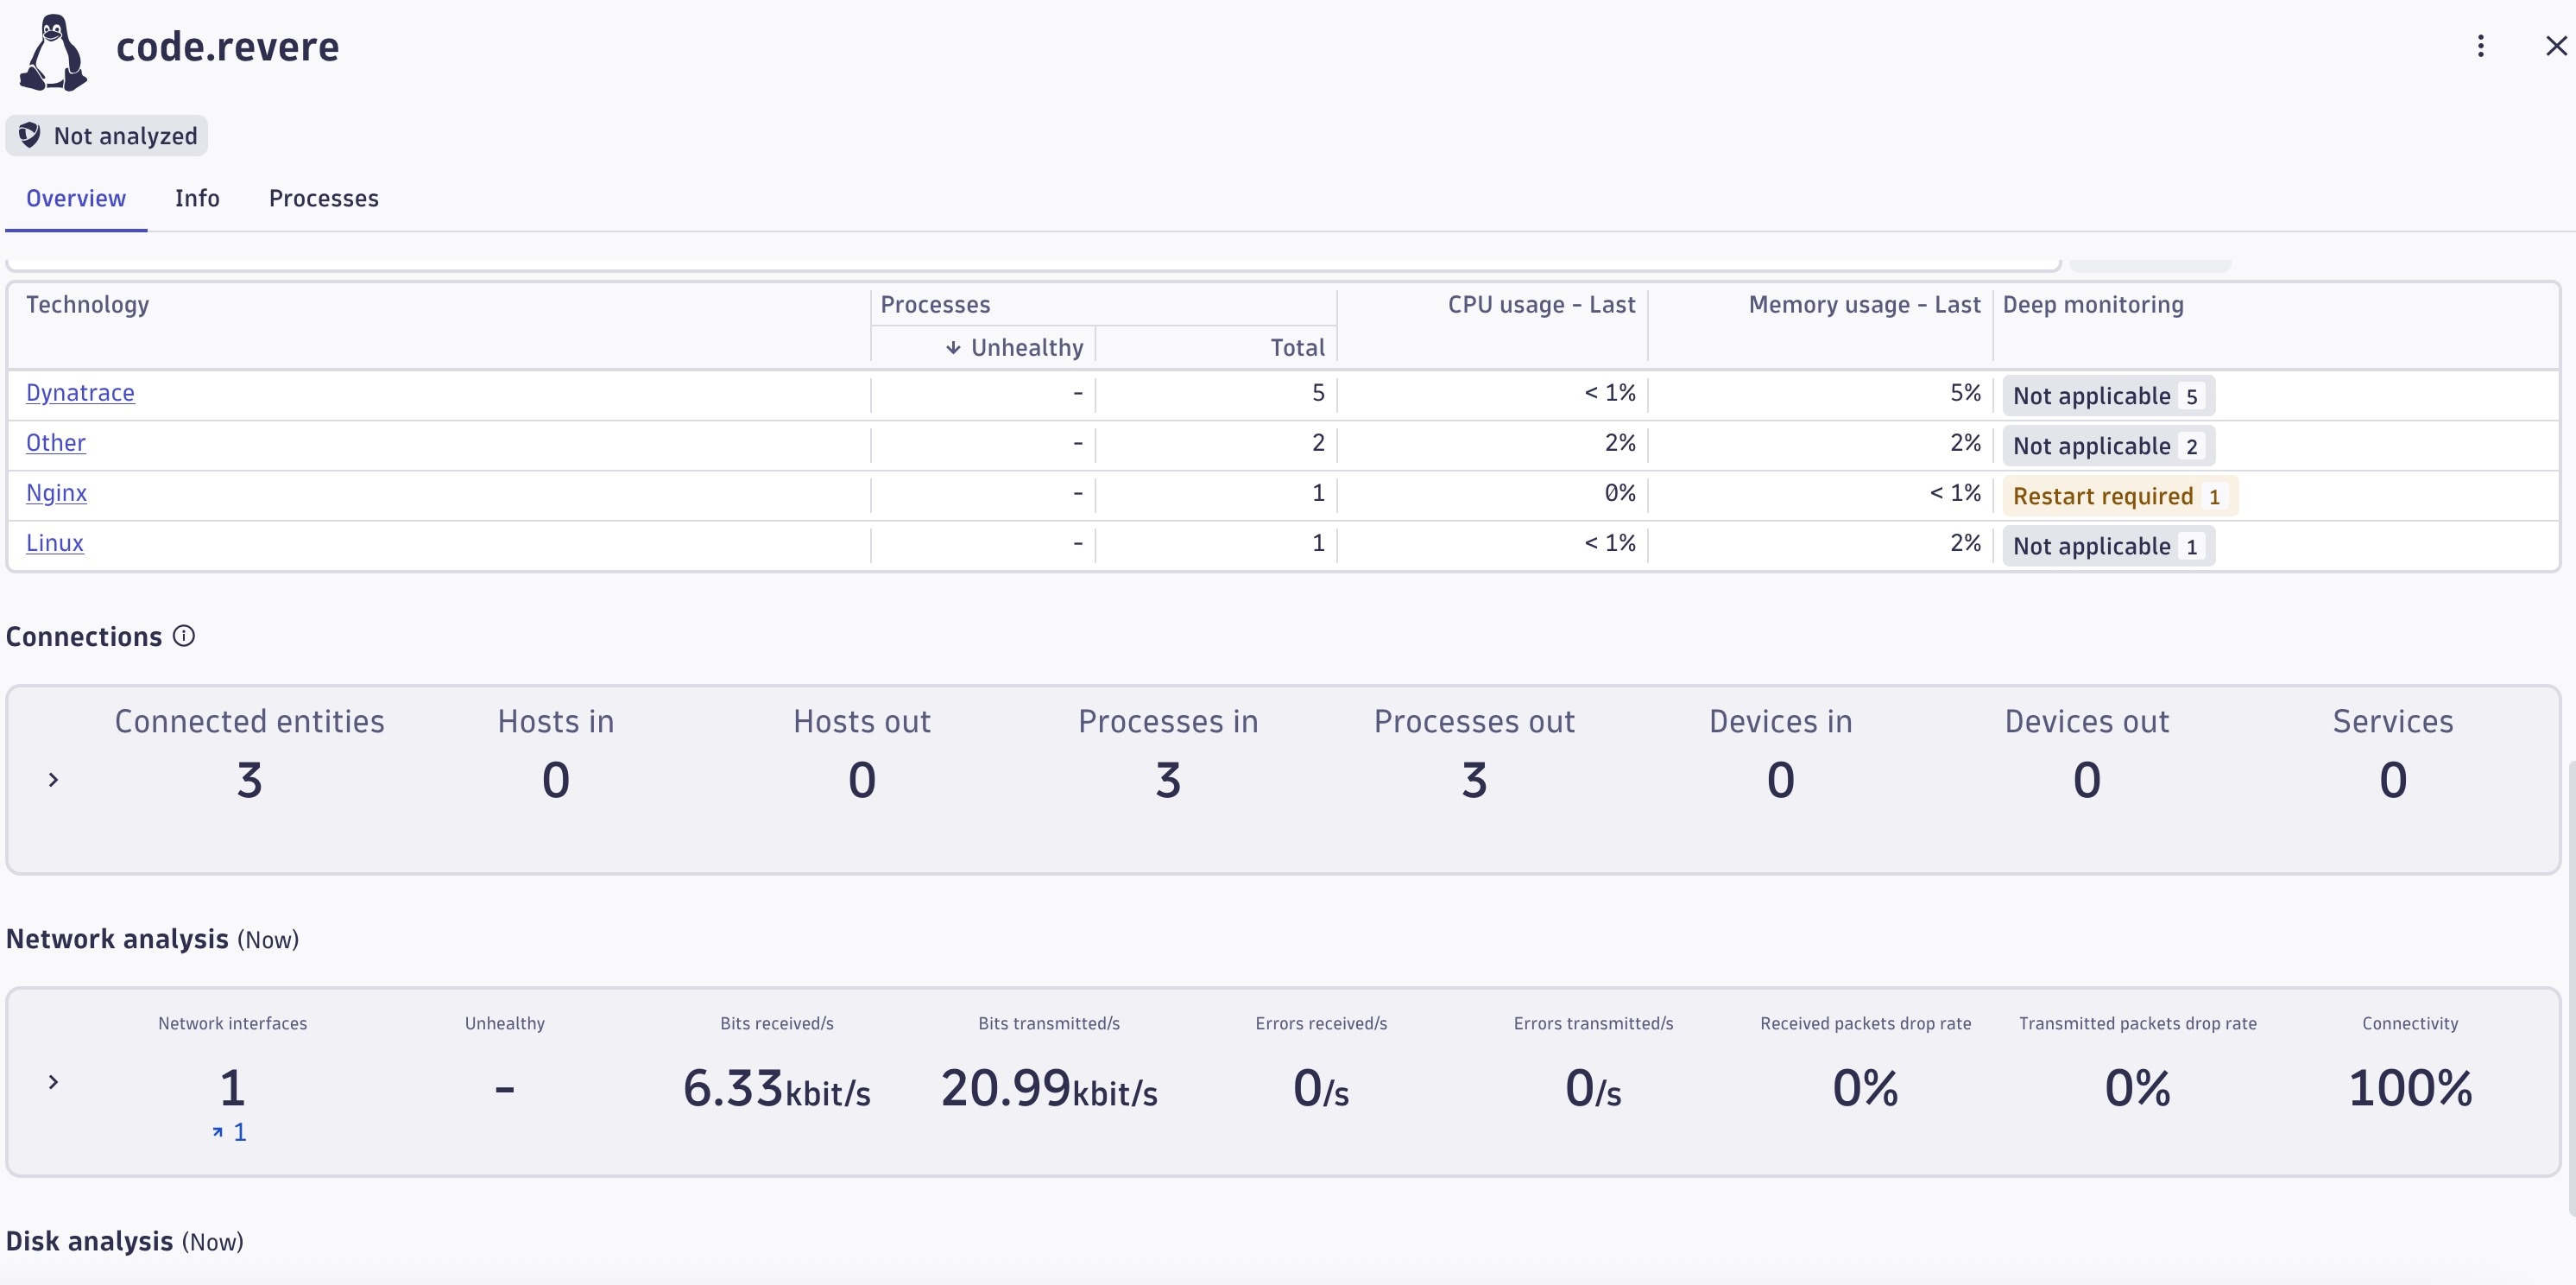
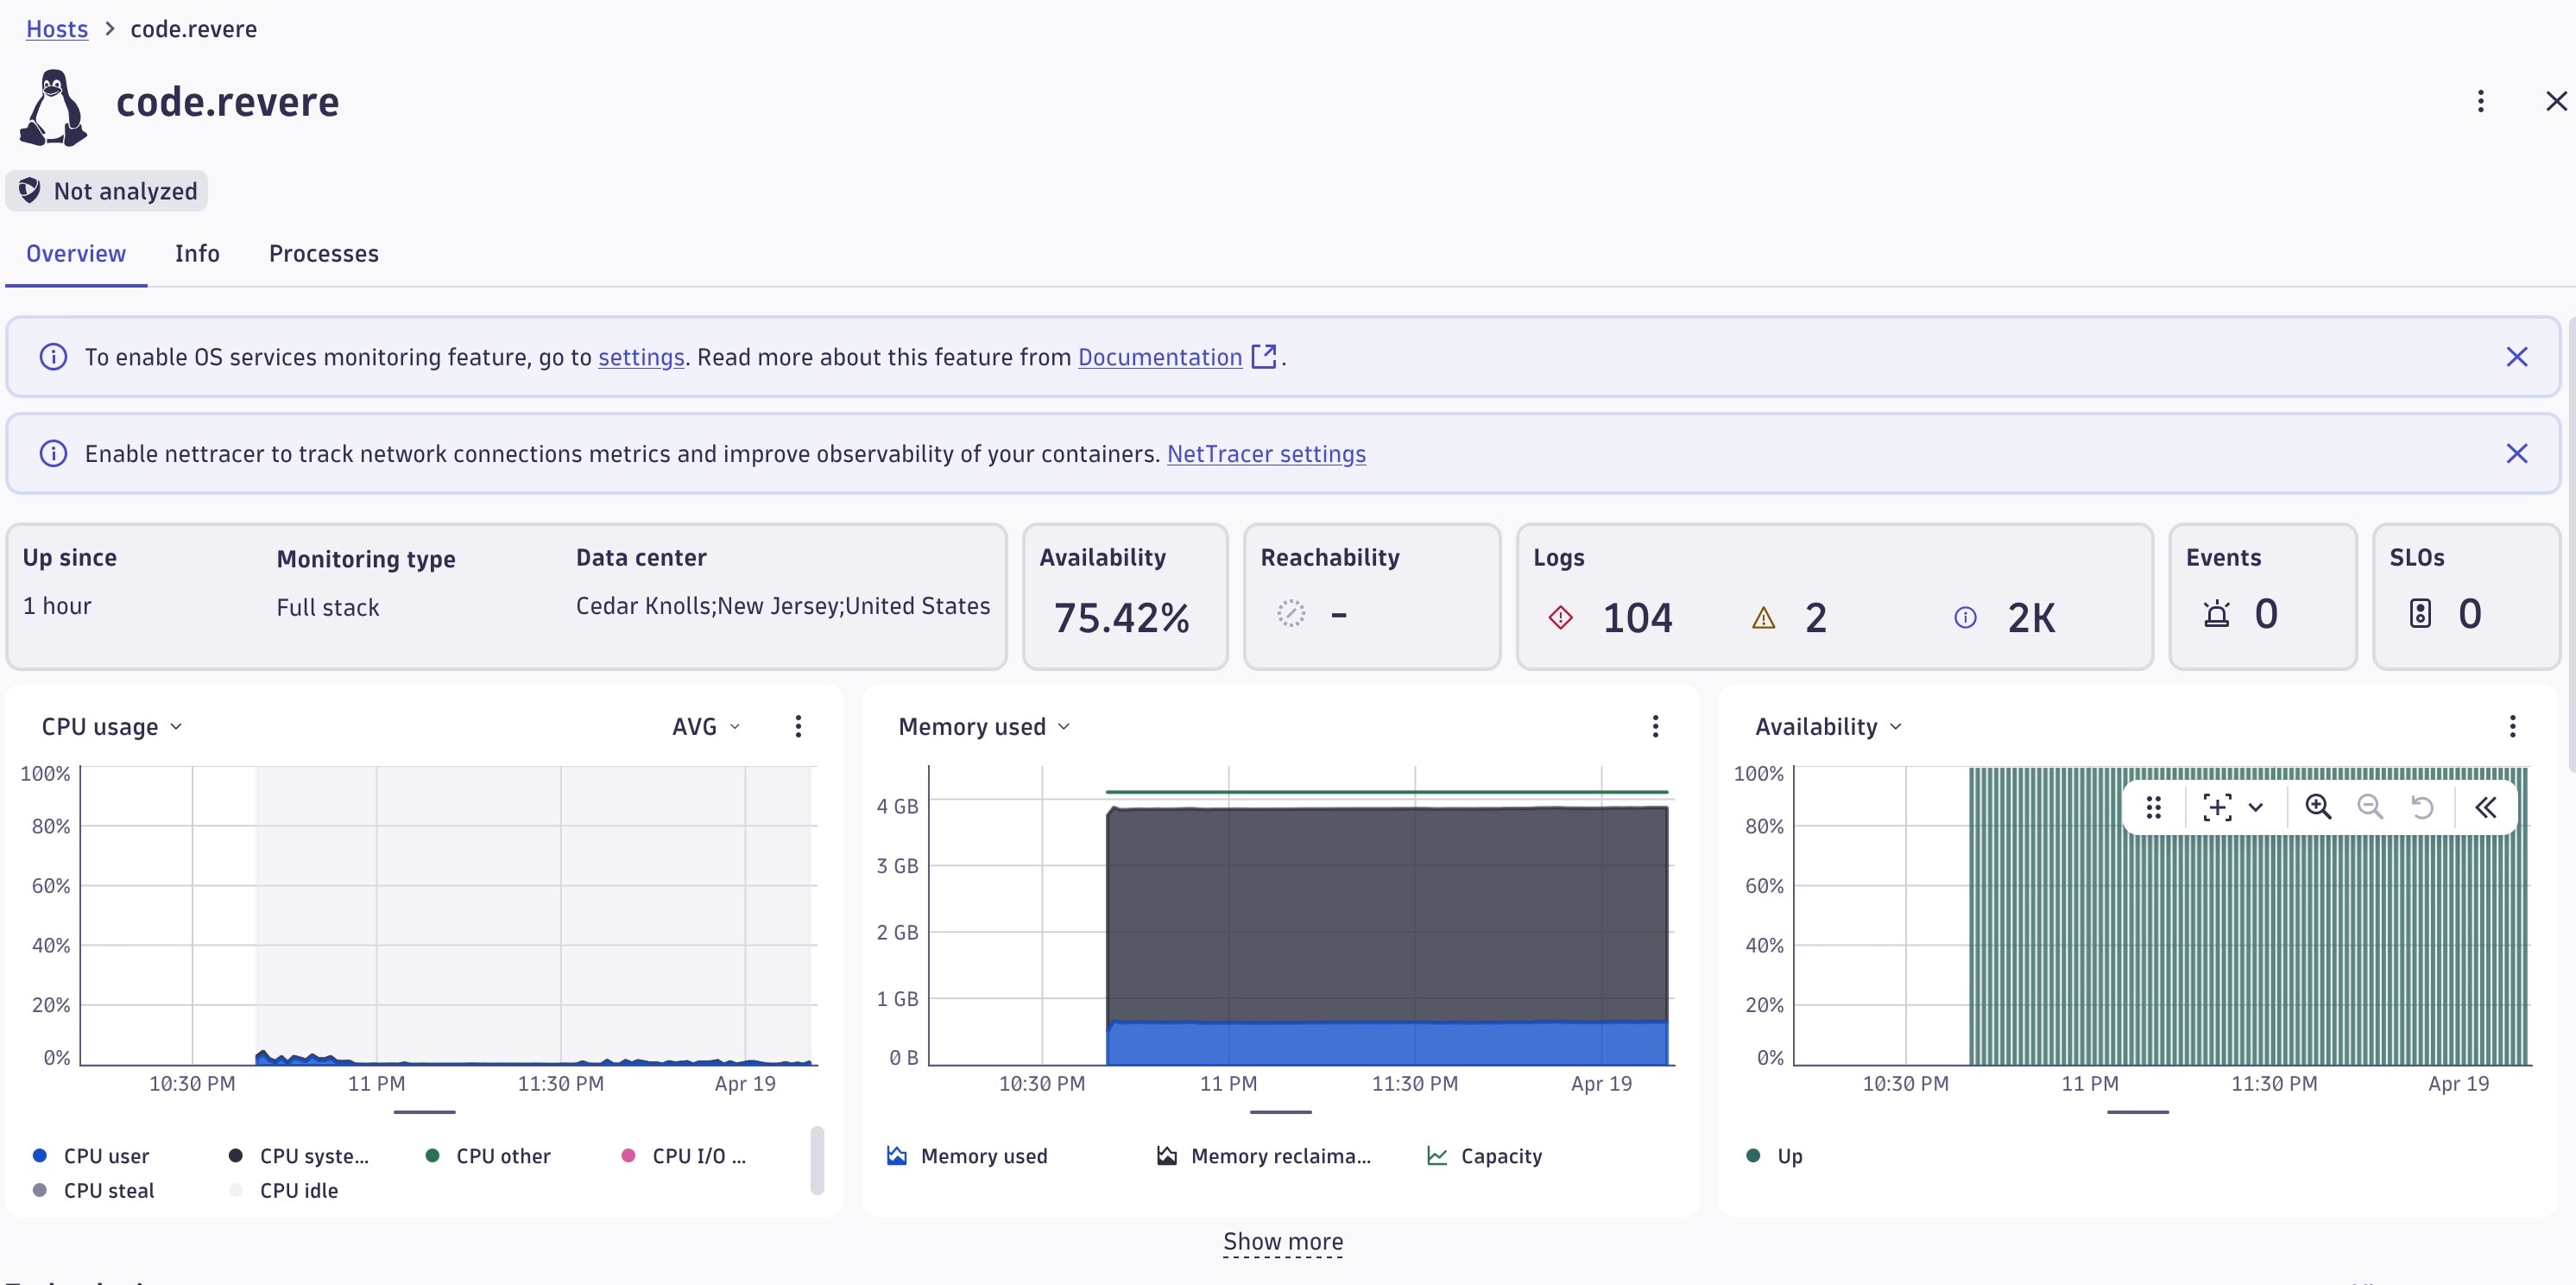
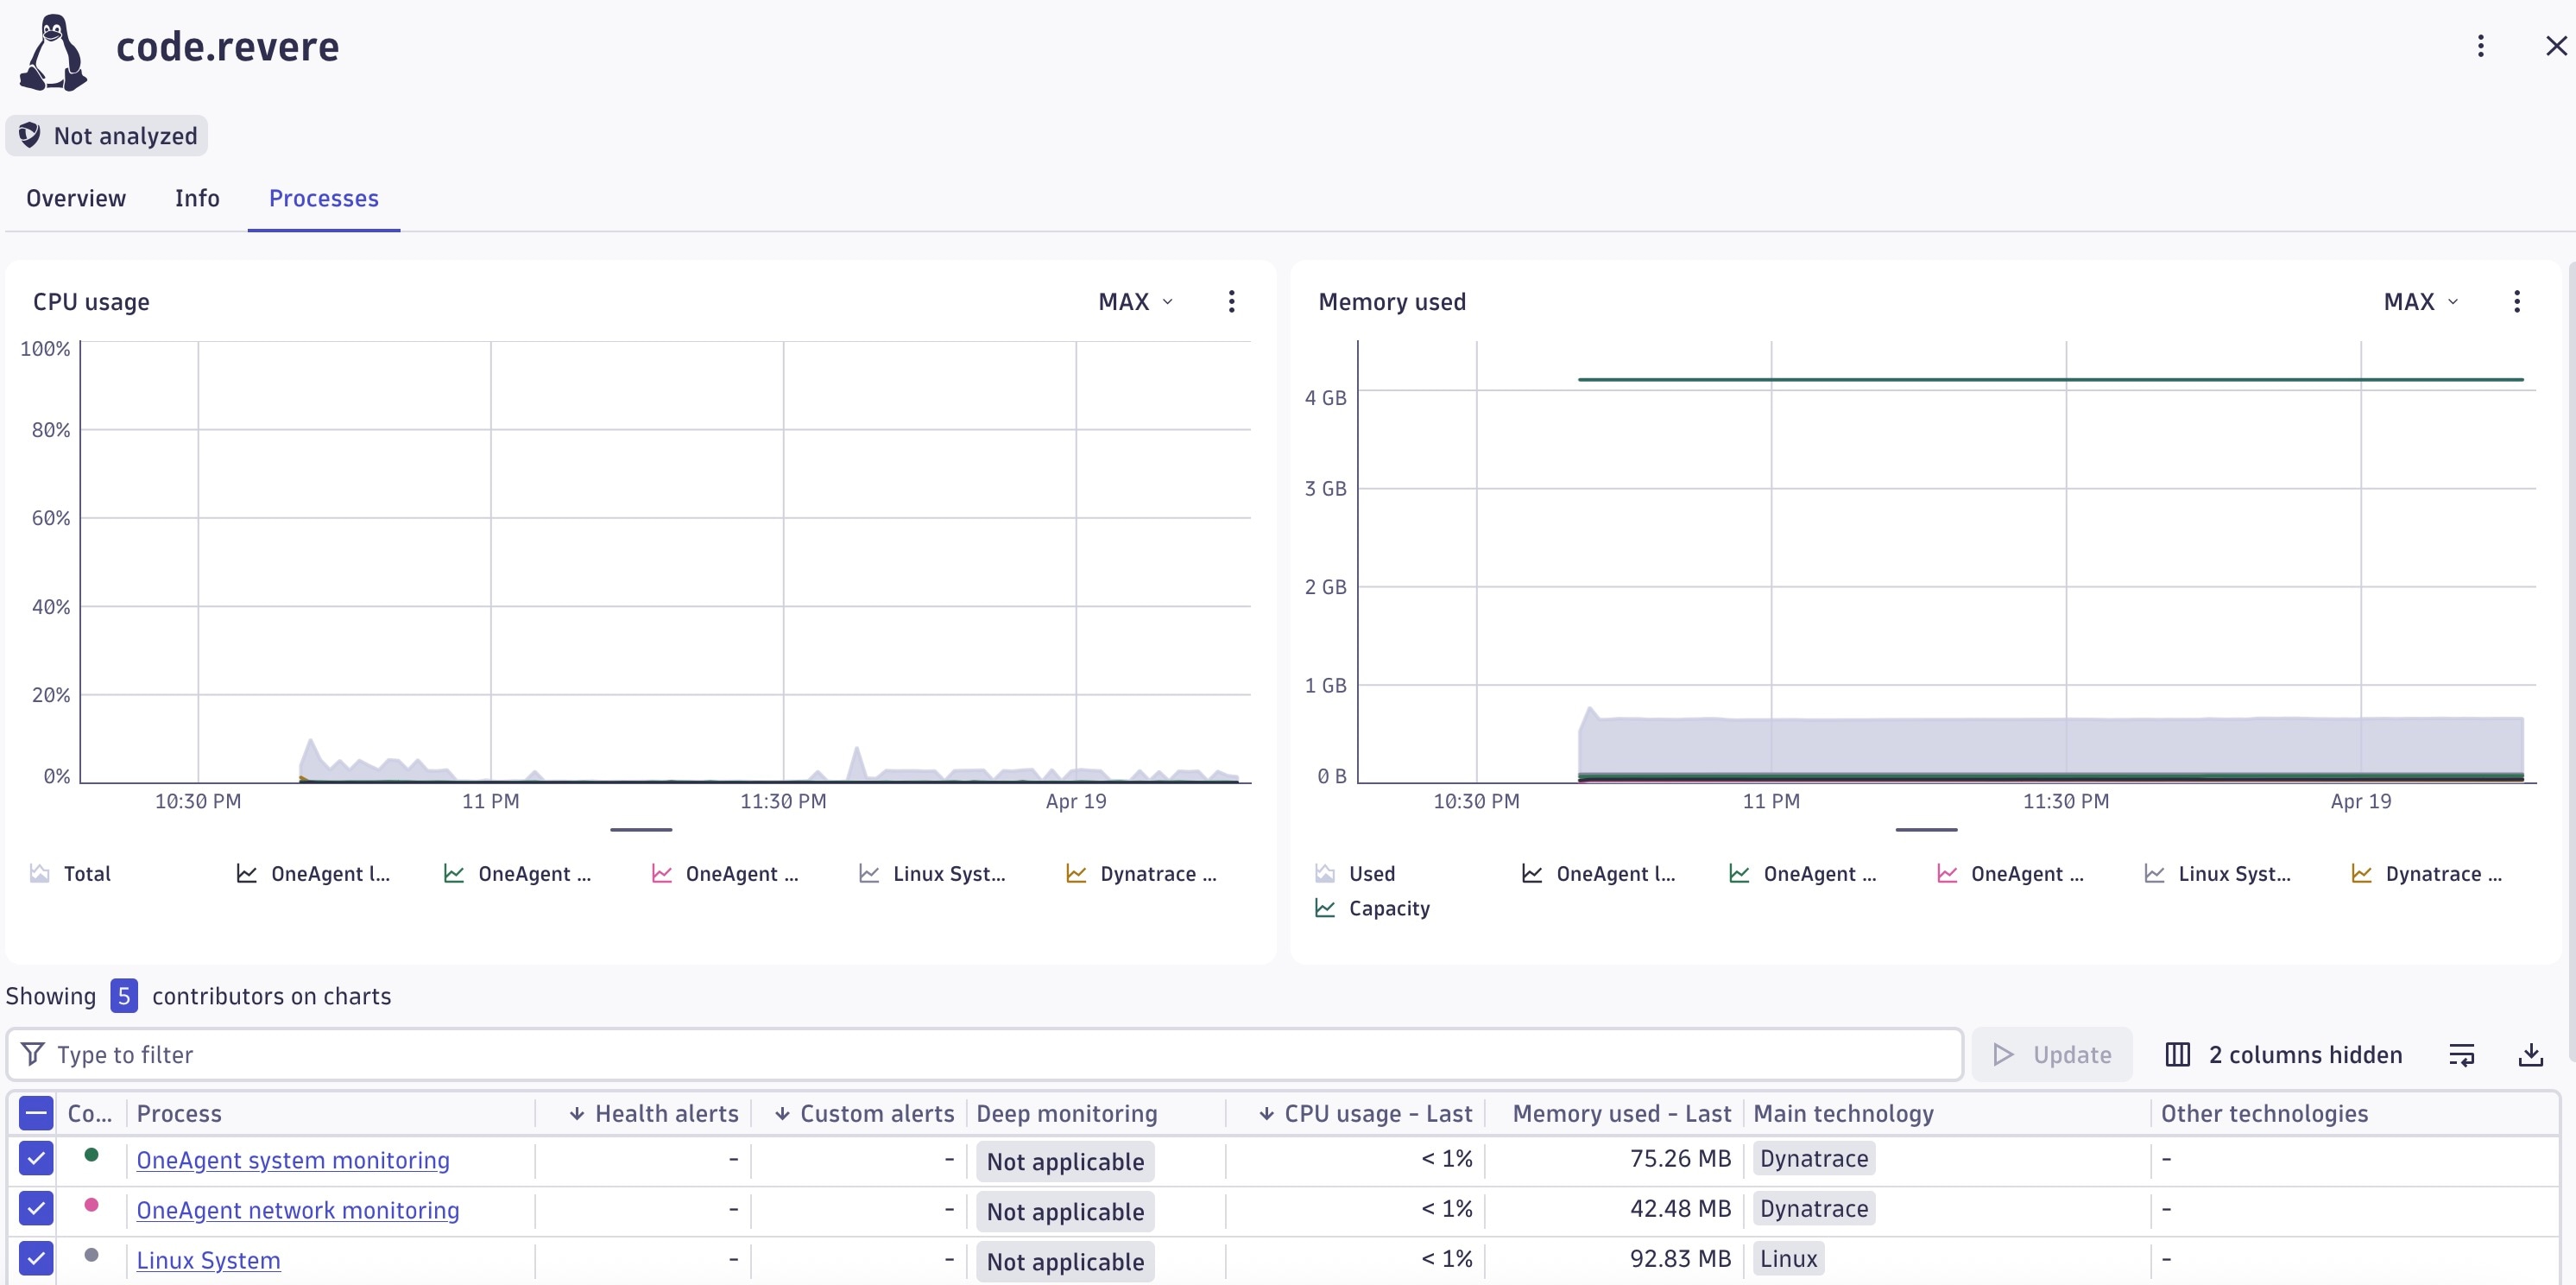
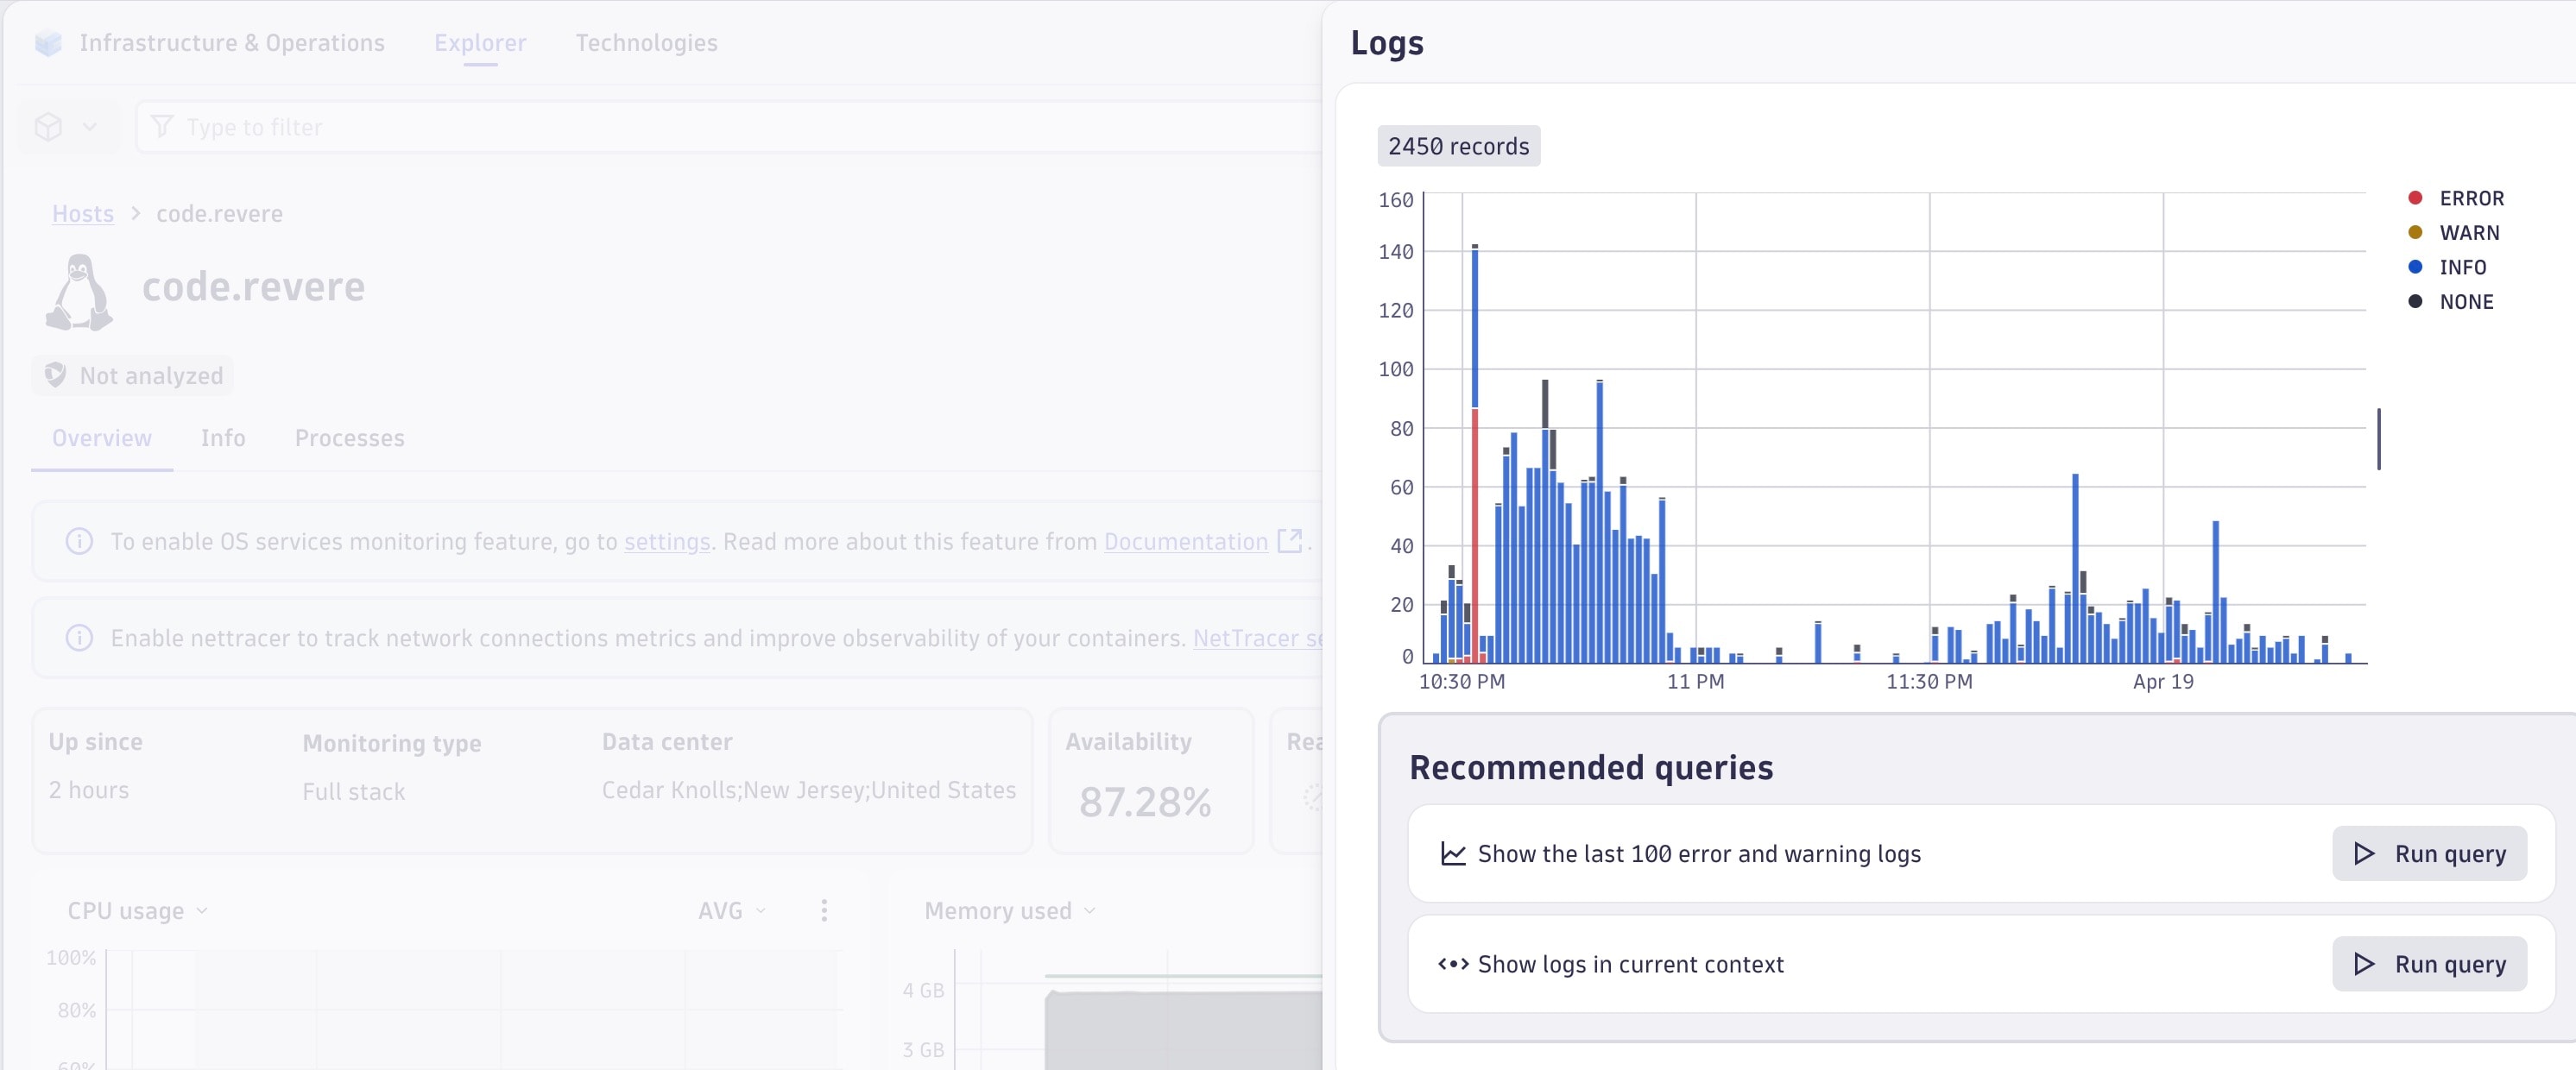
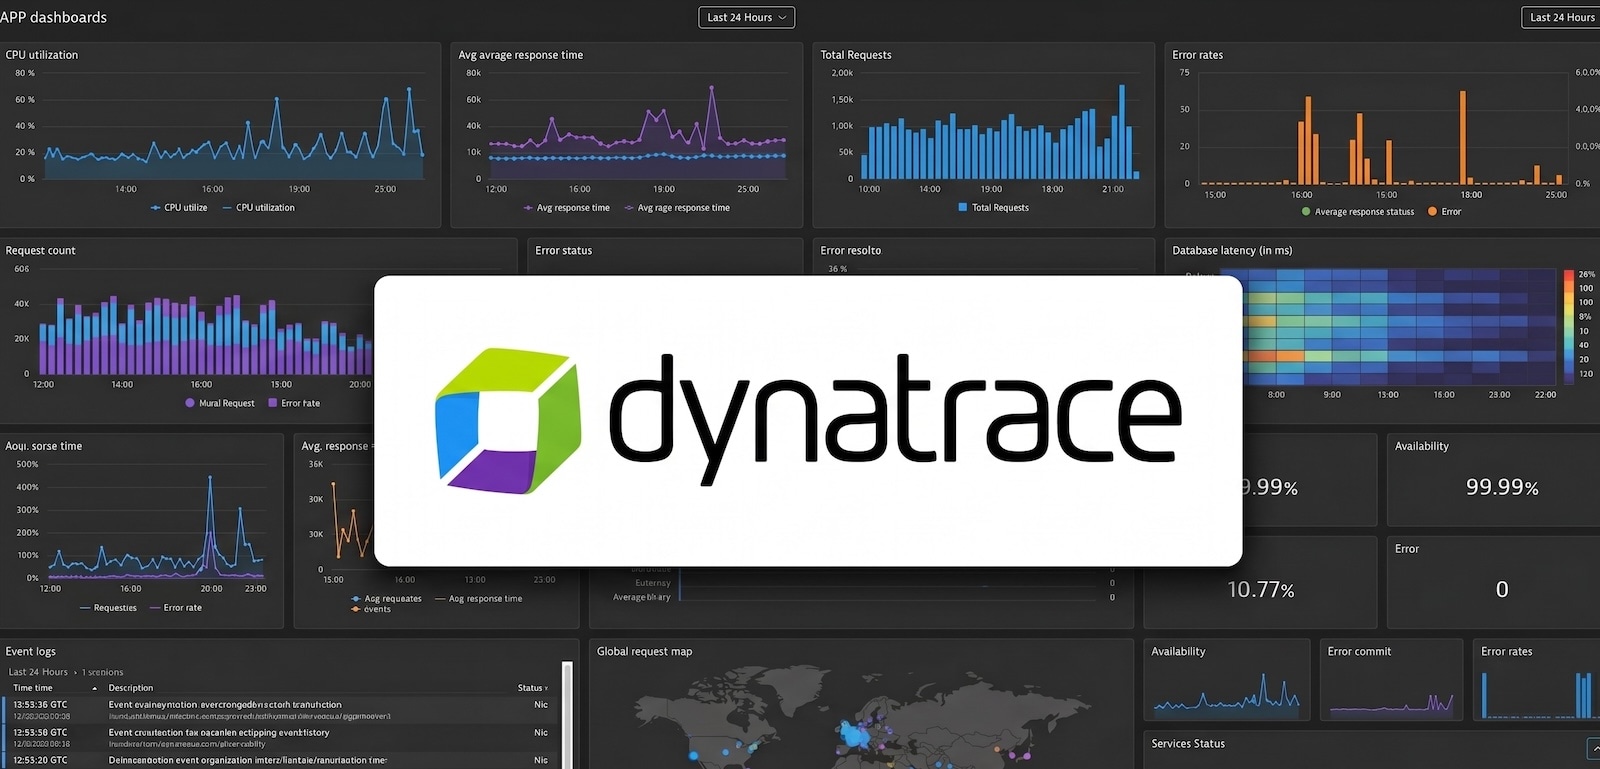
There they are! BEAUTIFUL dashboards with great visibility, thanks to the powerful Dynatrace stack. This blog is just the beginning, as there is so much more to configure and instrument. I will likely document my progress in future posts. Thanks for reading.